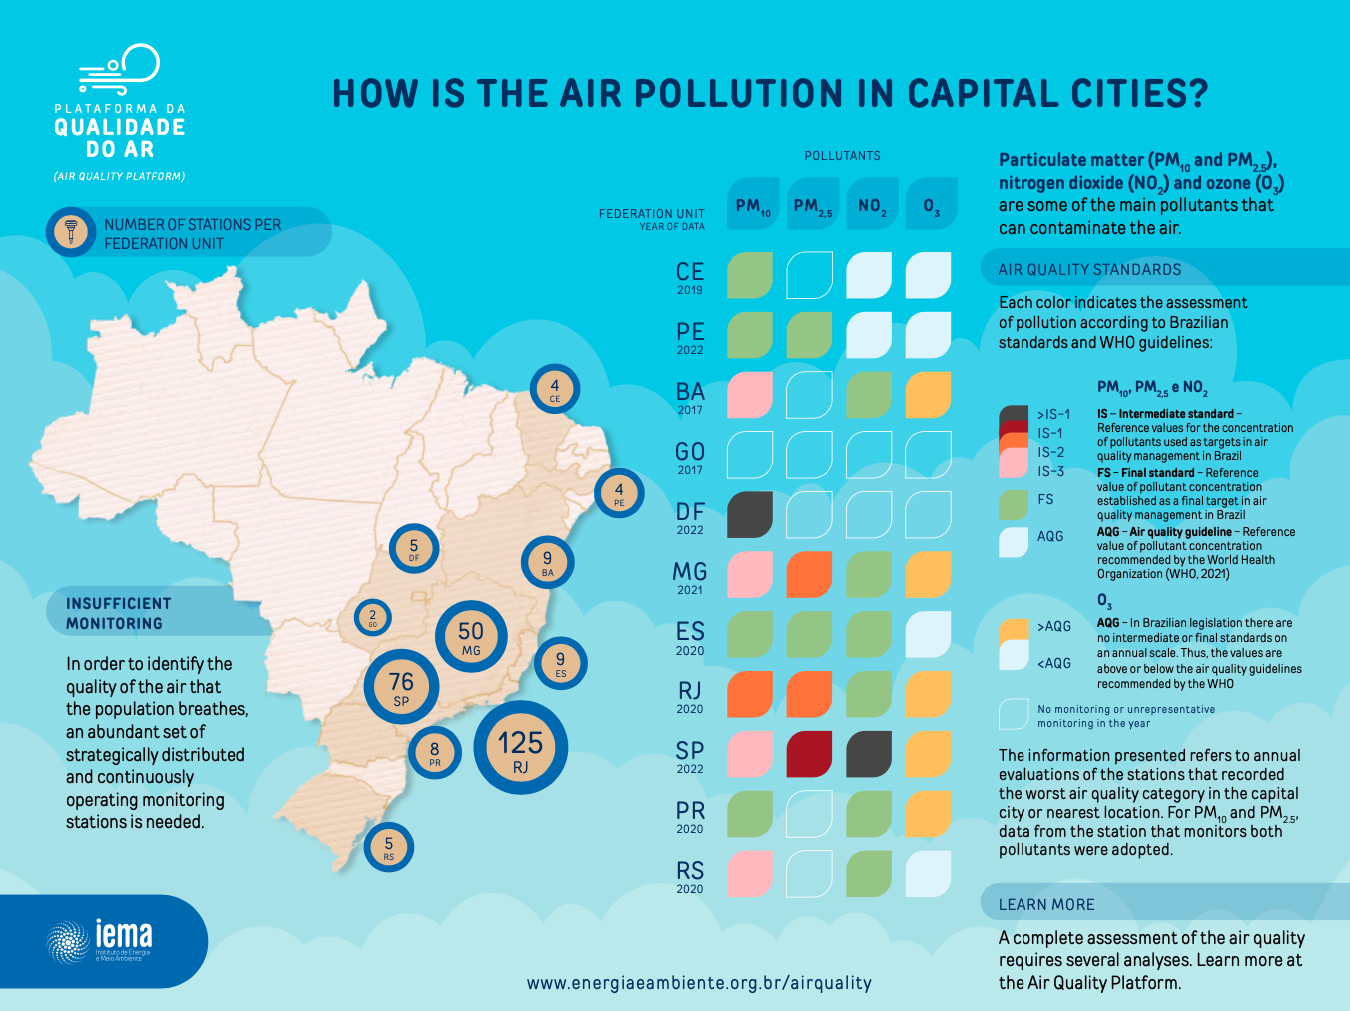
Air pollution causes many social and environmental problems. Regarding the health of the population, it causes various damages and even the aggravation of diseases that can lead to death. Another harmful effect is regarding the environment, polluting waterways and soil, thus negatively affecting natural ecosystems. This generates losses for agriculture and degrades urban infrastructure.
Knowing which pollutants are present in the air and their amount is the first step to face this serious problem. It is worth noting that the air quality in a given location varies according to the proximity of pollutant emission sources, meteorological conditions, and the topography of the region. Once poor air quality has been detected, it is then time to understand its causes in order to plan and implement strategies to control emissions of local pollutants and the population should be alerted to its risks.
The Institute of Energy and Environment (IEMA, the acronym in Portuguese) has presented the Air Quality Platform since 2015 to promote transparency of this information, which also helps conceive and improve public policies, with data and analyzes to monitor air quality in Brazil. This data is obtained and organized based on open sources, Annual Air Quality Reports for each Brazilian State, and, also, through the verification of the information directly with the environmental public agencies.
In the Platform the air quality data can be accessed according to the Air Quality Index (AQI) or compared to the air quality standards adopted in Brazil and guidelines established by the World Health Organization (WHO). Through the Air Quality Platform, it is possible to verify the air quality in the following interactive panels or in the databases available for download.
Monitoring and data coverage
Map of monitoring stations
In Brazil, states are responsible for monitoring air quality, with state environmental agencies each implementing and managing their own monitoring system. Based on the information contained in the Air Quality Platform, the interactive panel below shows where there are or have been monitoring stations in the country1, which pollutants are being and have been monitored, the state agencies in charge, and the type of technology used. It is possible to choose the pollutant(s) and view all the stations that monitor it on the map. Currently, the Platform provides air quality monitoring information for ten Brazilian states and the Federal District. See the monitoring coverage present in the Air Quality Platform over the years:
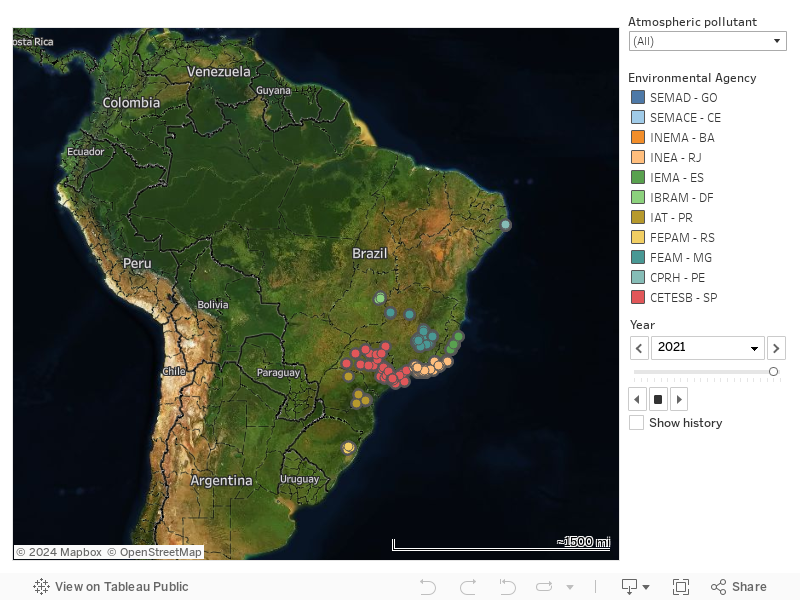
¹The platform covers data starting in 2000.
Data made available through the platform
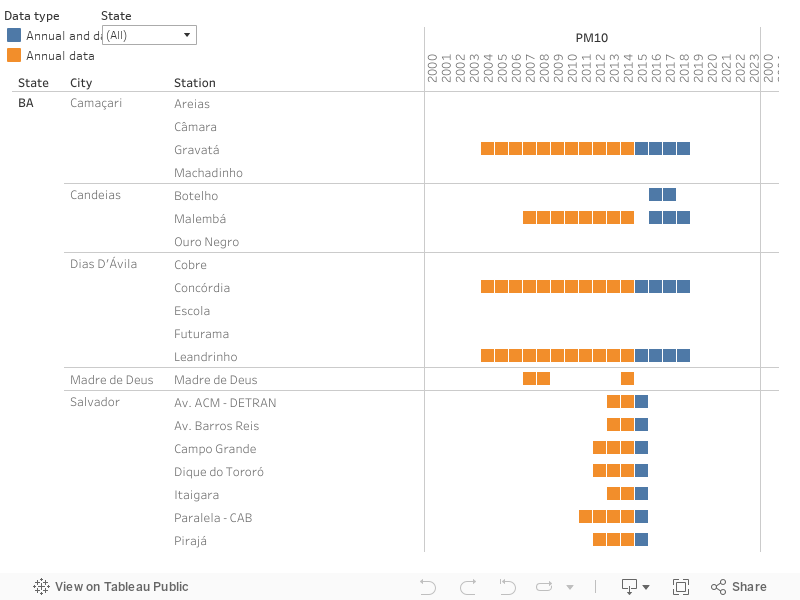
The panel below shows all the air quality monitoring stations mapped by the public agencies that have partnered with the Air Quality Platform, as well as the respective contents incorporated by IEMA: the respective pollutants monitored, the years with information on monitoring, and the time resolution provided in the data (daily or annual). Due to the large volume of data produced by different agencies with different systematic operations, the development of the Platform is continuously updated. Gradually, the Air Quality Platform incorporates new data informing the most recent monitoring, data from new partnerships, and enriches the historical series as they are made available by partner agencies and, later, organized by the IEMA team.
Day to day air quality
At each monitoring station
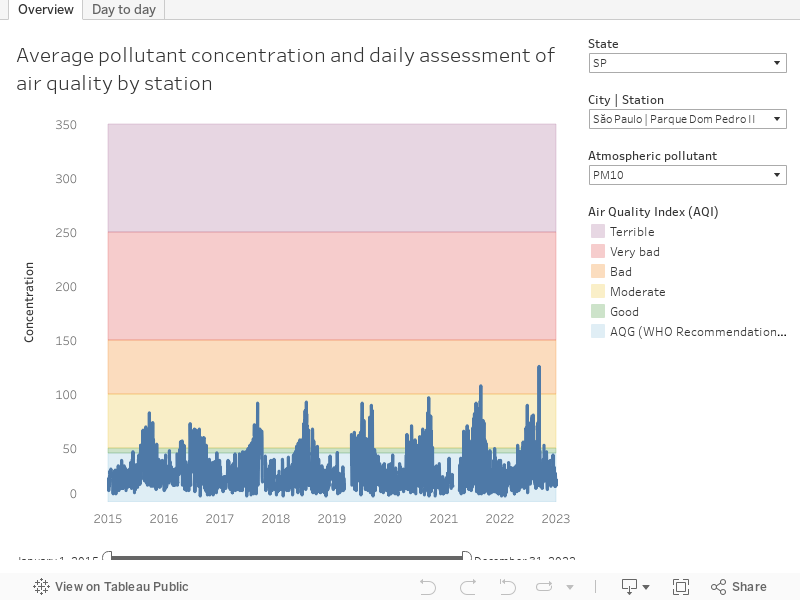
The atmosphere behaves quite dynamically. At a given time of day, the air can be more or less polluted depending on polluting activities or weather conditions. Therefore, air quality is generally monitored at an hourly rate. At the end of a day, the air quality can be evaluated based on an average value, calculated using the monitored concentrations of each pollutant. The higher the average value, the more pollutant was present in the air and the worse its quality. The air quality2 of a certain day is then classified as: good, moderate, bad, very bad or terrible – classes of the air quality index (AQI) adopted in Brazil –, with each level representing certain effects on health human.
On the dashboard, the first3 visualization shows the evolution of the average daily air quality with the index ranges in the background, also including an additional class that reflects the WHO air quality guidelines (AQG). A second visualization helps observe information on specific days, also allowing the viewer to compare the air quality standards adopted in Brazil4. To switch between views, select the desired tab at the top of the left panel.
2 Learn more about the classification of air quality in Brazil by here.
3Values classified as “good” are consistent with the 2005 WHO air quality guidelines. However, in 2021, these guidelines were updated, and the recommended maximum concentrations became more restrictive for PM10 and PM2.5. Click here to learn more about the new guidelines.
4 Learn more about air quality standards in Brazil by clicking here.
At all monitoring stations
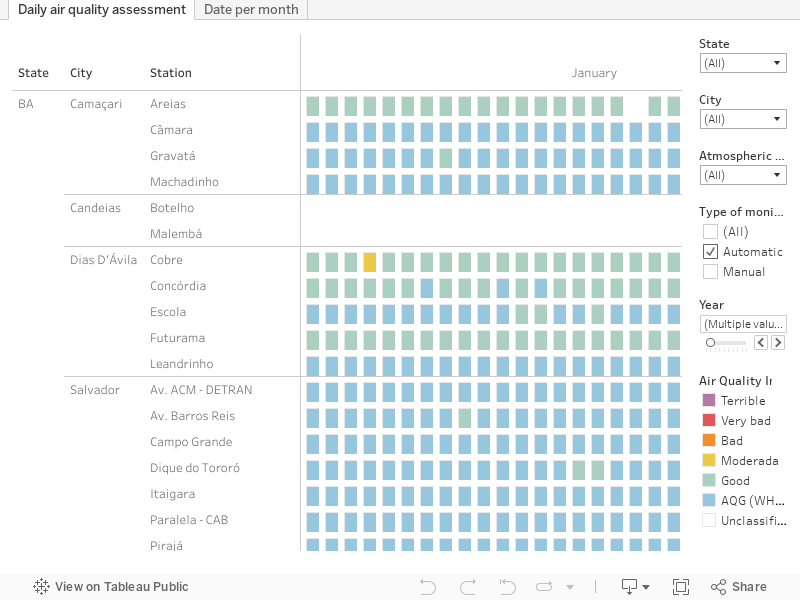
An overview of the daily air quality assessment in several stations, simultaneously, can be consulted in this panel. Each square is colored according to the Air Quality Index classification (and WHO air quality guidelines, as in the previous panel) for each season and pollutant on the day. By selecting “All” in the “Pollutant” filter, it is possible to see the overall air quality classification defined based on the pollutant with the worst classification. For example: if in a certain season the air quality for a pollutant was evaluated as “Very bad”, for another pollutant it was evaluated as “Moderate” and for all others it was evaluated as “Good”, the overall classification will be “Very bad”. Select station group via panel commands. Identify critical periods and areas.
In a second tab on the panel, it is possible to see the daily information aggregated by month, making it easier to observe the behavior of pollutants throughout the seasons. For example, generally the winter months in the southern hemisphere (between June and August) have higher concentrations of particulate matter. To switch between views, select the desired tab at the top of the left panel.
Total days in years
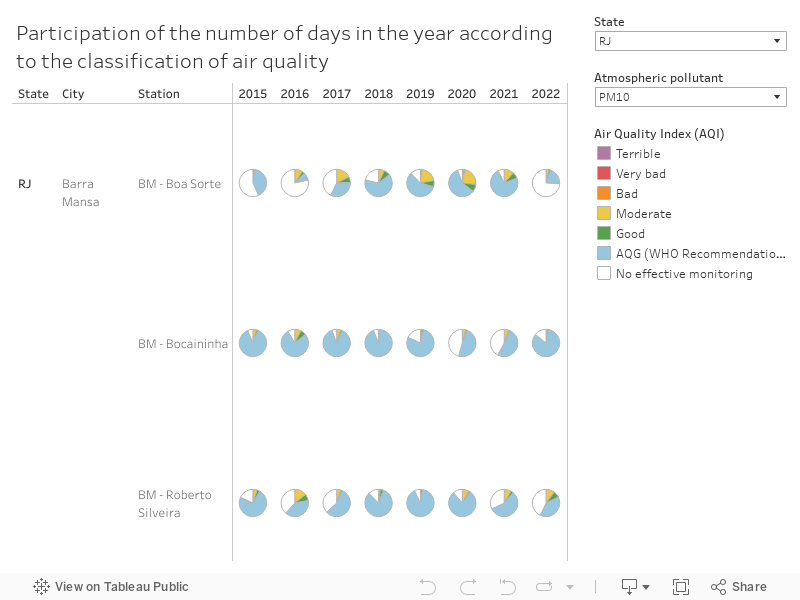
This panel shows the participation of the number of days in the year classified based on the air quality index (AQI) and the values recommended by the WHO for each season and pollutant. Thus, it is possible to have a panoramic view of the air quality for each pollutant, checking whether there is an increase or decrease in the number of more or less polluted days over the years. You can also note the days lacking information on air quality (effective monitoring).
Some air quality monitoring stations do not monitor on a continuous basis, being operated manually with less frequent data collection, usually every six days. Due to the incomparability with automatic stations, which collect data on a daily basis – except short maintenance periods (ideally) – manual stations are not shown in this panel.
Number of days exceeding national standards and WHO guidelines
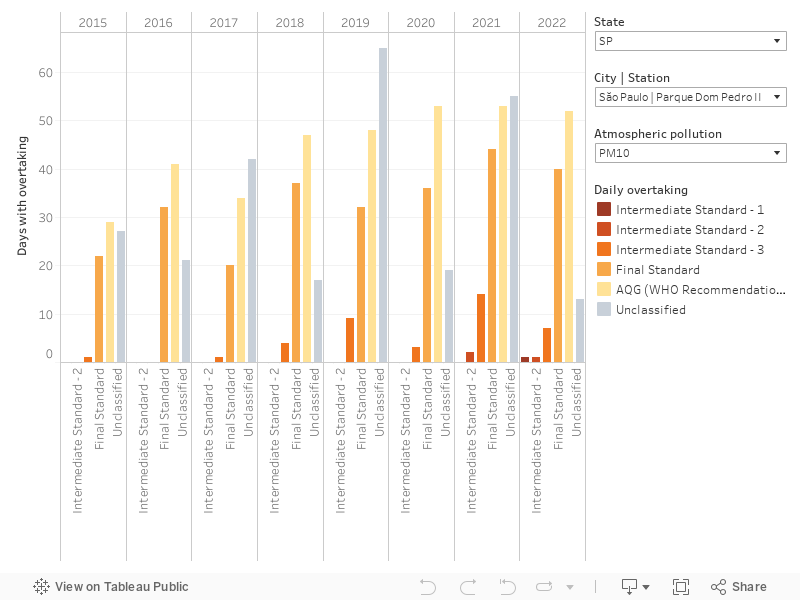
Air quality standards are reference values of concentration of pollutants that act as targets in air quality management. In Brazil, air quality standards are established by a Resolution of the National Council for the Environment (CONAMA, the acronym in Portuguese) No. 491/2018 and are organized into levels. There are intermediate standards (IS), from 1 to 3, which represent provisional or temporary values for a given polluted region, which over time should aim to continue advancing to higher standards, improving air quality in stages until reaching the final standard. The final standards (FS) follow the 2005 World Health Organization definitions. However, the WHO revised its recommendations and for PM10 and PM2.5 the recommended values became more restrictive in 20215. Thus, for the other pollutants, the AQG overshoots are equal to the FS overshoots.
In the panel below, it is possible to see how many days in the year exceeded air quality standards at a station for a given pollutant, as well as the number of days with average concentrations higher than WHO recommendations. The panel also shows the number of days when there was no effective monitoring to assess air quality on a daily basis.
5 Learn more about the differences between the final standards and WHO recommendations by clicking here.
Year-by-year air quality
At each monitoring station
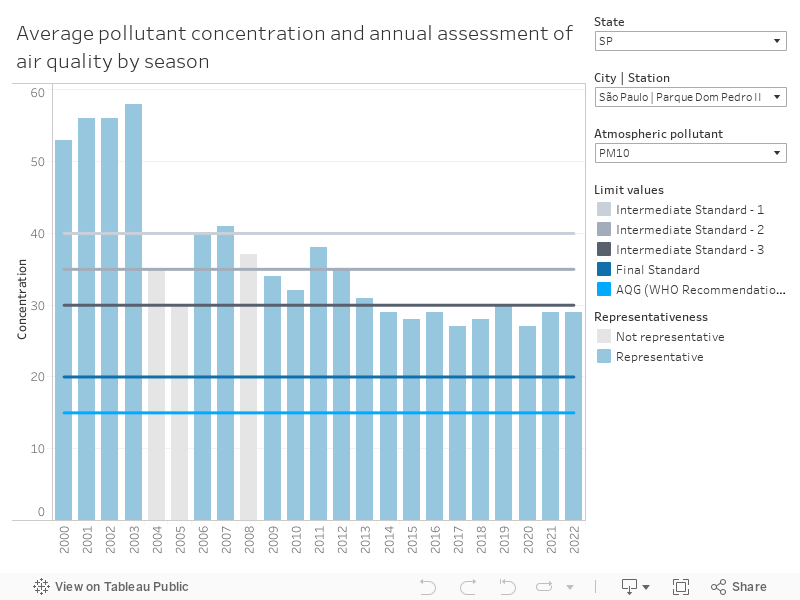
After a year has ended, air quality can be evaluated based on an average value, calculated through daily concentrations for each pollutant, considering representativeness criteria6. The higher the average value, the more polluted the air was throughout the year. Unlike the daily assessment of air quality, the air quality index (AQI) is not applied in the annual assessment. However, there are air quality standards adopted in Brazil for assessing air quality on an annual scale, as well as values guidelines by the WHO.
Currently, Brazil has up to 4 standards, depending on the pollutant. Three standards are interim or intermediate (intermediate standards 1, 2 and 3) and there is the final standard. In addition to demonstrating the lines (limit values) of the standards in force by the National Council for the Environment (CONAMA), the visualization below shows the limit value recommended by the WHO (Air Quality Guideline, AQG). In this panel, when choosing a monitoring station and a pollutant, we can assess whether or not the level of air pollution in the year exceeded the value recommended by the WHO, or the air quality standards in Brazil, in addition to observing the representativeness of the data on the yearly scale.
6 Learn more about representativeness criteria or sample validation by clicking here.
At all monitoring stations
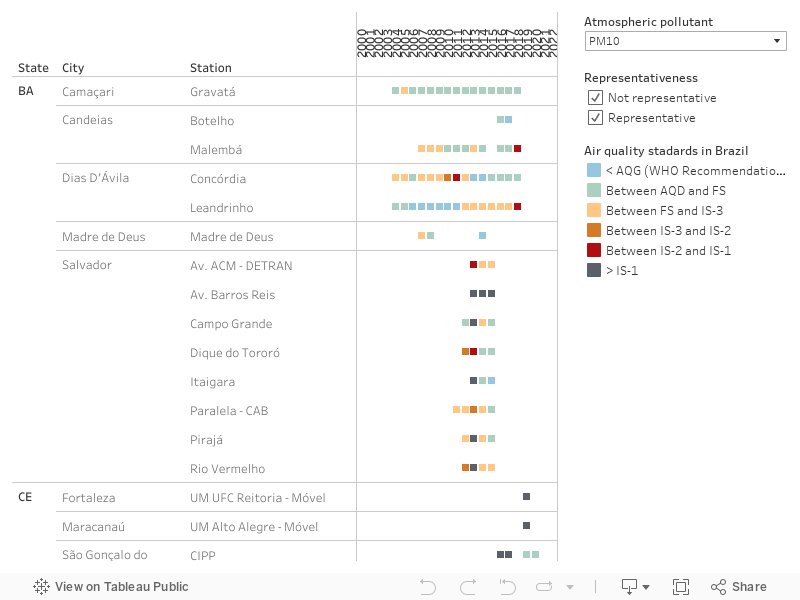
An overview of the annual air quality assessment, simultaneously at several stations, can be consulted in this panel. Each square is colored according to the range in which air quality was measured for each season and pollutant in the year, relative to air quality standards and WHO recommendations, according to the previous panel. In the key, FS is an acronym for final standard, IS is an acronym for intermediate standard, and AQG refers to the WHO air quality guideline. When selecting “All” in the “Pollutant” selector, it is possible to see the general classification of air quality, defined based on the pollutant classified with the worst range. For example: if at a certain station the air quality for a pollutant was assessed as “Between IS-2 and IS-1”, for another pollutant it was assessed as “Between IS-3 and IS-2” and for all others it was assessed as “< AQG”, the overall rating will be “Between IS-2 and IS-1”.
Select the station group via panel commands. Identify critical periods and areas.
Map of yearly air quality assessment
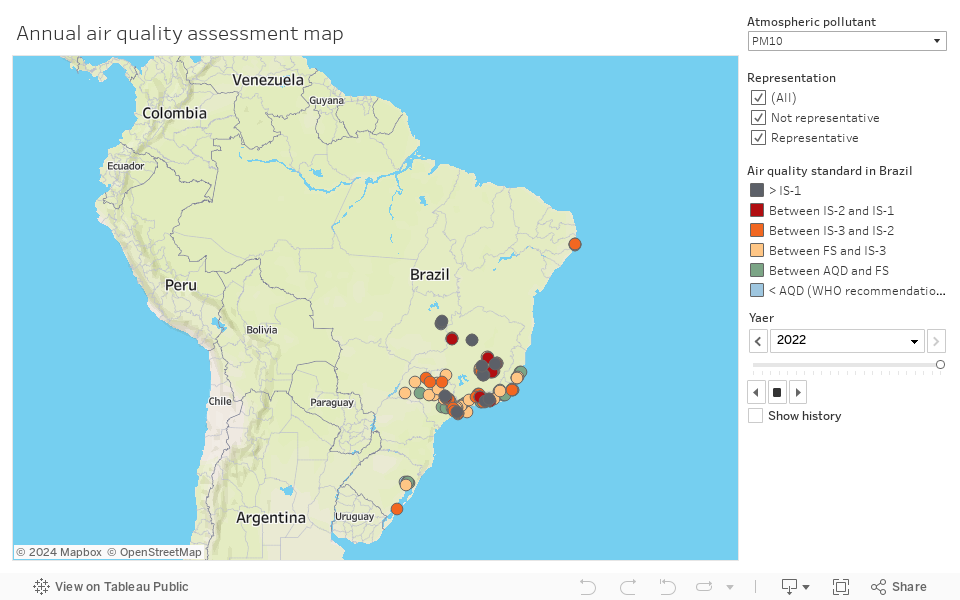
This panel presents the air quality assessed on an annual scale for each monitored station, locating it on the map. With the data identified with their latitudes and longitudes on the map, critical regions are observed, where most stations have conflicting values according to the WHO recommendation, i.e., most stations present concentrations of at least one pollutant with values that can be harmful to the health of the population.
An air quality monitoring network is composed of a set of stations installed in strategically defined locations. According to the Brazilian Ministry of Environment (2019), monitoring stations should be classified according to their spatial representation, in increasing order of scope: microscale, medium scale, neighborhood scale or urban scale. This spatial representativeness class for each station is defined according to the pollutant monitored and the characteristics of the surroundings. Microscale stations are characterized by the presence of intensive emission sources in their immediate surroundings and aim to observe the most direct effect of these sources on air quality. In turn, an urban scale station, the one with the greatest spatial coverage, seeks to measure the background pollution of the city, which represents the minimum levels of environmental atmospheric pollution to which the population is chronically exposed. Mid-scale and neighborhood-scale stations are intermediate classes. On the panel, it is possible to consult the scale classification when placing the cursor over each station.
Downloading data
Would you like to build your own queries based on data from the Platform?
Download the data contained in the Air Quality Platform, organized in a standardized format by the IEMA team, and work freely with them!
- Bahia
- Ceará
- Distrito Federal
- Espírito Santo
- Goiás
- Minas Gerais
- Paraná
- Pernambuco
- Rio de Janeiro
- Rio Grande do Sul
- São Paulo
If possible, share your analysis with us: contato@qualidadedoar.org.br.
In the next section, you can consult the links to the original content made available by public agencies that are partners of the Platform.
Platform Partners
Currently, more than ten public agencies collaborate with IEMA on the Air Quality Platform. Learn more about air quality in other content they make available:
Federal District
Institute for the Environment and Water Resources of the Federal District - Brasília Environmental Institute (IBRAM-DF)
State of Bahia
State Secretariat for the Environment (SEMA-BA)
State of Espírito Santo
State Secretariat for the Environment and Sustainable Development (SEMAD-GO)
State of Goias
State Secretariat for the Environment and Sustainable Development (SEMAD-GO)
State of Minas Gerais
State Foundation for the Environment (FEAM)
State of São Paulo
Environmental Company of the State of São Paulo (CETESB)
State of Rio de Janeiro
State Institute of the Environment (INEA)
State of Rio Grande do Sul
State Foundation for Environmental Protection (FEPAM)
City of Rio de Janeiro
- Location of fixed air quality monitoring stations
- Hourly data from fixed air quality monitoring stations
- Location of air quality monitoring mobile station campaigns
- Hourly data from mobile air quality monitoring campaigns
- Daily data from the Air Quality Index – AQI
- Air quality bulletins
- Maximum measured value and percentage of valid data by pollutant, by monitoring station, and national air quality standards between 2011-2019
Ministry of the Environment
Methodological aspects
Air Quality Index (AQI)
The Air Quality Index (AQI) was created to facilitate the dissemination of short-term air quality monitoring data (daily assessments). According to the Technical Guide for Monitoring and Assessing Air Quality (Brazilian Ministry of the Environment, 2019), the index is prepared using mathematical equations that convert the pollutant concentration values – whose unit can be expressed, for example, in micrograms per cubic meter (μg/m3) or parts per million (ppm) – for dimensionless numbers, i.e., without a pre-established physical unit of comparison.
In this way, air quality can be classified as: good, moderate, bad, very bad, and terrible and associated with a color scale (gradually representing the severity of effects on human health and the environment). The structure of the index and the pollutants that are part of it are as follows:
Structure of the Brazilian index of air quality and health effects
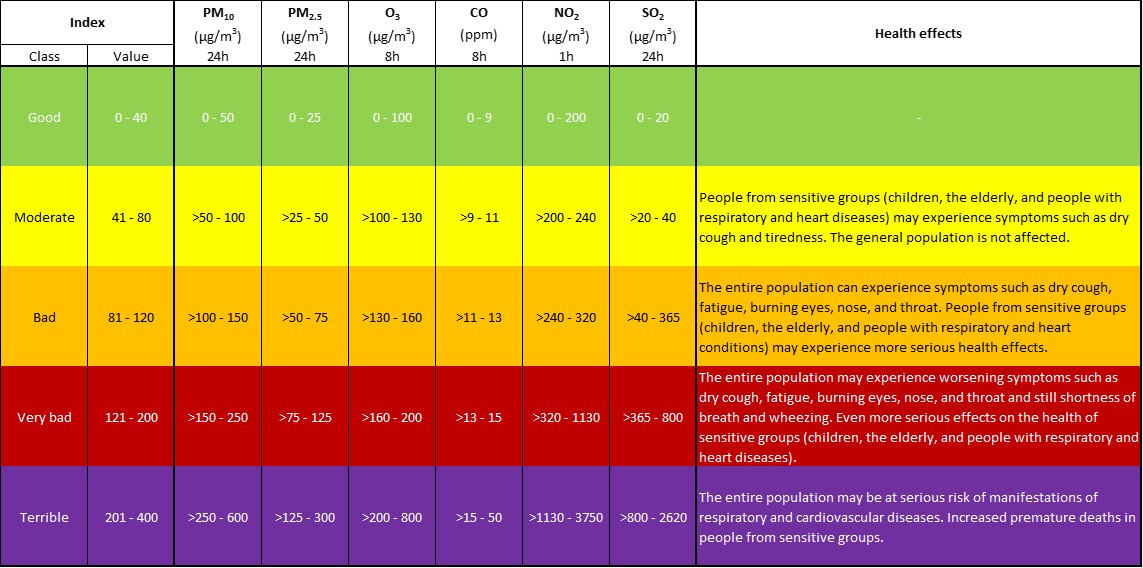
Fonte: Adapted from the Brazilian Ministry of Environment (2019) and Cetesb
Air quality standards in Brazil
Air quality standards are reference values of pollutant concentration that serve as targets in air quality management. In Brazil, they are established by the Resolution of the National Council for the Environment no. 491/2018 and are organized in levels. There are intermediate standards (IS), 1 to 3, which represent provisional or temporary values for a given polluted region, which over time should aim to continue advancing to higher standards, cleaning up the air in stages until reaching the final standard. The final standard (FS) follows the 2005 World Health Organization classifications.
National air quality standards

Source: Conama Resolution no. 491/2018
WHO air quality recommendations (guidelines)
The WHO presented its newest standard values for pollutant concentrations in 2021, based on recent studies and evidence that consider health impacts. For the most part, these values have become more restrictive. The table below shows the Final Standard values (values consistent with WHO recommendations in 2005) and the guidelines updated in 2021.
| Pollutant (acronym) | Unit | Reference period | AQG |
| Particulate matter (PM10) | µg/m3 | Annual | 15 |
| µg/m3 | 24h | 45 | |
| Fine particulate matter (PM2.5) | µg/m3 | Annual | 5 |
| µg/m3 | 24h | 15 | |
| Sulfur dioxide (SO2) | µg/m3 | 24h | 40 |
| Nitrogen dioxide (NO2) | µg/m3 | Annual | 10 |
| µg/m3 | 1h | 200 | |
| Carbon monoxide (CO) | ppm | 8h (moving average) | 9 |
| Ozone (O3) | µg/m3 | 8h (moving average) | 100 |
| µg/m3 | Peak season | 60 |
Source: PAHO/WHO, WHO Global Air Quality Guidelines (2021): Inhalable Particulates (PM₂.₅ and PM₁₀), Ozone, Nitrogen Dioxide, Sulfur Dioxide, and Carbon Monoxide. Executive Summary.
Pollutants, metrics, and benchmarks for assessing air quality
On the Air Quality Platform, data are presented classified according to the Air Quality Index (AQI) or comparable to air quality standards and WHO recommendations. The pollutants, metrics, and benchmarks for assessing air quality present on the Platform are summarized in the table:
| Pollutant (acronym) | Time resolution | |
| Day | Year | |
| Smoke (SMK) | 24h average (IS-1, IS-2, IS-3, FS) |
Annual arithmetic mean (IS-1, IS-2, IS-3, FS) |
| Particulate matter (PM10) | 24h average (IS-1, IS-2, IS-3, FS, AQI, AQG) |
Annual arithmetic mean (IS-1, IS-2, IS-3, FS, AQG) |
| Fine particulate matter (PM2.5) | 24h average (IS-1, IS-2, IS-3, FS, AQI, AQG) |
Annual arithmetic mean (IS-1, IS-2, IS-3, FS, AQG) |
| Sulfur dioxide (SO2) | 24h average (IS-1, IS-2, IS-3, FS, AQI, AQG) |
Annual arithmetic mean (IS-1, IS-2, FS) |
| Total suspended particules (TSP) | 24h average (FS) |
Annual geometric mean (FS) |
| Ozone (O3) | Maximum 8-hour moving average recorded on the day ( IS-1, IS-2, IS-3, FS, AQI, ,AQG) |
Maximum moving average every 6 months – “Peak season” (AQG) |
| Carbon monoxide (CO) | Maximum 8-hour moving average recorded on the day (FS, AQI,AQG) |
– |
| Nitrogen dioxide (NO2) | 24h average (AQG) |
Annual arithmetic mean (IS-1, IS-2, IS-3, FS, AQG) |
Validation of air quality samples
Ideally, air quality should be monitored continuously, i.e., second by second, hour by hour. At the end of a day or at the end of a year, air quality can be assessed based on average values calculated from these hourly concentrations. For these average values to have statistical significance, validation criteria based on the completeness of the data are adopted. The table shows the criteria recommended by the Brazilian Ministry of the Environment, which are adopted in the Air Quality Platform:
| Average type | Validation criteria |
| Hourly average | ¾ of valid averages within the hour |
| Daily average | ⅔ of valid averages within the day |
| Monthly average | ⅔ of valid averages within the month |
| Annual average | ½ of valid averages recorded every four-month period (Jan-Apr; May-Aug; Sept-Dec) |
| Peak season average for O3* | ⅔ of the daily moving average over the past 6 months. |
*To calculate the peak season average for O3, the maximum six-month moving average was considered. The year-by-year evaluation for the pollutant refers to the period of winter, spring, summer, and autumn – in that order, i.e., from June 21 of one year to June 20 of the following year – to fully cover the critical period of ozone concentration in the southern hemisphere (spring and summer).
Source: Brazilian Ministry of the Environment (2019) and WHO (2021)
Log of updates
The Air Quality Platform is periodically updated with new data, texts, visualizations, and possible corrections. To access the log of changes and follow its Evolution, click here.
Publications
The IEMA team prepares analyzes based on the Air Quality Platform in order to inform society about Brazilian air quality problems and assist public authorities in decision-making. In December 2021, the first study was published, with analyzes obtained using the Platform data, which focused on the municipality of Macaé (Rio de Janeiro), and in May 2022, on the municipality of São Paulo (São Paulo). In July 2022, the work “Recommendations for the Expansion and Continuity of Air Quality Monitoring Networks in Brazil” was published.


Support: