Generation of electricity, emissions and list of companies that own fossil fuel and public service thermoelectric plants of the National Interconnected System (base year 2020)
PRESENTATION
Since the beginning of the 2000s, the Brazilian electric matrix has been undergoing a transition in which the expansion of installed capacity and hydroelectric generation gives way to a growing diversification of generation sources. If, on the one hand, there was a marked expansion of biomass, wind and solar sources, on the other hand, there was an expansion of the use of fossil fuels for electricity generation. This generation increased from 30.6 TWh in 2000 to 84.8 TWh in 2020, almost triple.
Giving the environmental, social and economic implications of this transition, the Instituto de Energia e Meio Ambiente (IEMA) has been dedicating itself to a set of studies and analyses in order to draw the attention of the government, non-governmental organizations, the media, researchers and society in general to the environmental impacts of thermal power plants. The result of this work has been disseminated through a series of publications aimed at providing subsidies to the process of evaluation, environmental licensing and qualification of enterprises. In addition, it seeks to contribute to the spread of information and decision-making on the feasibility of these projects.
Thermoelectric energy generation and its correlation with pollutant emissions were addressed in two of the first publications: “Regulação ambiental da termeletricidade no Brasil – controle de emissão de poluentes” and “Geração termoelétrica e emissões atmosféricas: poluentes e sistemas de controle”. More recently, also exhibited in the “Boletim Leilão de Energia Elétrica” (published periodically) and in the technical note “Qualidade do Ar em Macaé (RJ)”.
Based on these studies, a database was consolidated with technical and environmental parameters of the plants, such as: type of fuel used, thermodynamic cycle, types of control systems adopted, potential of aerial emissions and use of water for cooling. An improved data consolidation methodology was then established, including criteria for cases with missing or inconsistent information.
This publication systematizes this data in emission rankings of the public service thermoelectric power plants that provided energy to the National Interconnected System, as well as their respective owners.
It is important to highlight that the use of the Reports of Potentially Polluting Activities and Users of Environmental Resources of the Brazilian Institute of the Environment and Renewable Natural Resources (IBAMA) was chosen as a source of information, as they proved to be more complete in terms of the availability of fuel consumption data and local emissions of air pollutants. For this reason, the base year adopted for this inventory is 2020, since information for the year 2021 is not yet completely available.
The publication of this first edition has gained a special importance recently when fossil fueled thermoelectric plants, especially natural gas, have earned space as immediate alternatives to complement poor hydroelectric generation and prevent the risk of electricity rationing. The publication is also timely when looking at the medium and long term, with the expected installation of 8,000 MW in gas powered plants spread in all regions of Brazil – which will be on the system between 2026 and 2030 – and with the postponement of subsidies and the lifespan of coal-fired power plants until 2040.
The current context of the electricity sector presents high risks for its decarbonization plans towards a 100% renewable matrix, as well as for improving air quality in the country. Thus, with this first edition of the inventory, aimed at executives in the electricity sector, environmental activists, financial analysts, investors, journalists, regulators and policymakers, IEMA is placed in the role of qualified information provider and critical observer of environmental impacts that have occurred in recent years and also expected for the next two decades.
EXECUTIVE SUMMARY
ELECTRICITY GENERATION
Scope of this inventory
- The thermoelectric generation database used to list the plants inventoried here concerns the public service thermal plants which provided energy to the National Interconnected System (SIN), excluding both self-producing and renewable fuel plants. The thermoelectric generation in isolated systems (Sisol), supplied by small or medium-sized plants with little availability of information, is also out of the scope of this first edition of the inventory.
Brazilian electric matrix in transition
- Since the beginning of the 2000s, the Brazilian electric matrix has undergone a transition characterized by the increasing participation of non-hydro renewable sources, such as biomass and wind, and by the expansion of the use of fossil fuels. In the last two decades, total electricity generation has grown by 78%, while generation through the hydraulic source has expanded by only 30%.
- Fossil fueled thermoelectric generation increased by 177%, growing from 30.6 TWh in 2000 to 84.8 TWh in 2020. Consequently, the total number of greenhouse gas (GHG) emissions in the Brazilian electricity sector increased by 90% between 2000 and 2020.
- The thermoelectric generation from the set of power plants in this study was 54.1 TWh in 2020. Altogether, 41.3 TWh were produced from natural gas (36 plants), which corresponds to 76% of the total. In second place, coal (8 plants) was responsible for the generation of 10.8 TWh, which represents 20% of fossil electricity production. On the other hand, petroleum products, fuel oil (17 plants) and diesel oil (11 plants) had a more discreet participation with joint production lower than 2 TWh (4%).
Generation ranking by thermal power plant
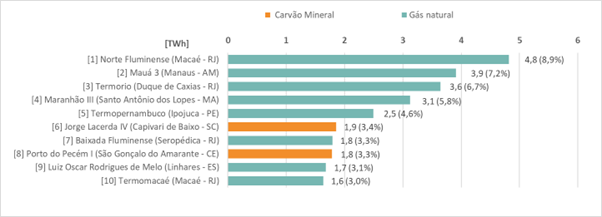
- Just five power plants accounted for 33% of all the thermoelectric generation inventoried: Norte Fluminense with 4.8 TWh (8.9%); Mauá 3 with 3.9 TWh (7.2%); Thermorio, 3.6 TWh (6.7%); Maranhão III, 3.1 TWh (5.8%); and Termopernambuco with 2.5 TWh (4.6%). In addition, 49% of the inventoried generation came from only ten plants (figure below) and almost all of the electricity produced in 2020 (94%) was made available to the National Interconnected System (SIN) by only half of the total set of power plants.
Energy efficiency ranking of thermal power plants
- The energy efficiency of a thermal power plant indicates the portion of the energy released by the fuel that is converted into electricity. More efficient plants burn less fuel and emit fewer greenhouse gasses per gigawatt-hour (GWh) produced.
- At the lower end of efficiency are coal-based thermal power plants, while natural gas plants occupied the first nine places in the efficiency ranking of the public service fossil fueled thermoelectric power plants.
- Among the ten power plants with the lowest energy efficiency, five are powered by coal. Among the worst are Pampa Sul and Candiota III, with only 27% efficiency.
Distribution of electricity generation in the territory
- Although the Northeast subsystem concentrates the largest number of thermoelectric power plants (28 units), the Southeast/Midwest subsystem (which has 19 power plants) generated more fossil electricity in 2020 (20.9 TWh – 39% of the total inventoried).
- There is a concentration of generation in a few units of the federation: 81% of the fossil-origin electricity was produced in only eight states. Rio de Janeiro, Amazonas and Maranhão accounted for more than 52% of the total fossil-origin electricity produced – Rio de Janeiro produced 25% (13.4 TWh).
- Fossil fuel thermoelectric plants linked to SIN are distributed in at least 41 cities, however 51% of the generation was concentrated in only five cities: Manaus (AM), Macaé (RJ), Santo Antônio dos Lopes (MA), Capivari de Baixo (SC) and Duque de Caxias (RJ).
GREENHOUSE GAS EMISSIONS
Ranking of emissions by thermal power plant
- The 72 inventoried power plants emitted 32.7 million tons of carbon dioxide equivalent (CO2e) in 2020. Only 12 plants emitted 55% of greenhouse gasses (GHGs),eight powered by coal as the main fuel and another four by natural gas (figure below). Almost all of CO2e inventoried (94%) came from only 36 plants, representing half of SIN’s public service fossil fueled power plants.
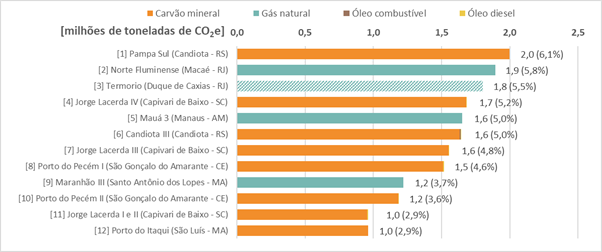
Note: Termorio is a power plant for cogeneration of electricity and steam. Therefore, part of its emissions may have come from steam generation and not electricity.
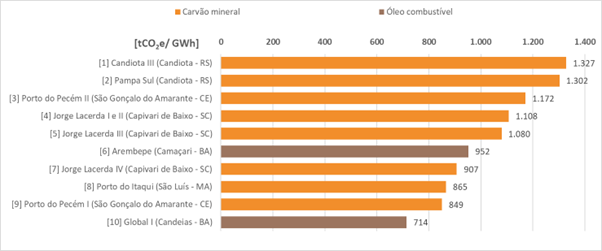
Emissions rate per thermal power plant (tCO2e/GWh)
- For a comparative assessment of the performance of thermal power plants in terms of emissions, a very appropriate indicator is the rate of emissions, determined by the ratio between emissions and electricity generation of a power plant. The figure below shows the ten thermal power plants with the highest emission rates. Eight of them use coal.
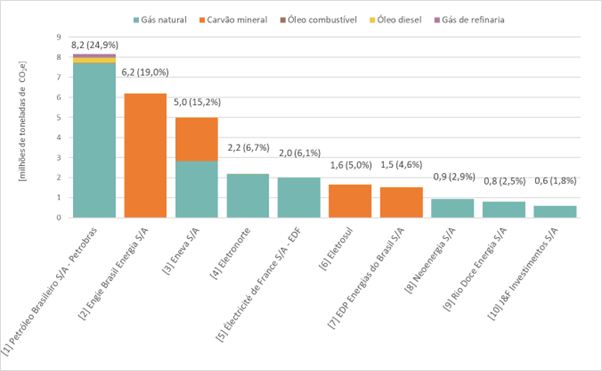
Ranking of emissions by energy companies
- Fossil fueled thermoelectric generation and CO2eemission were allocated by energy companies according to their respective shareholding stakes in each inventoried power plant. Although there were a relatively large number of energy companies (41), 72.3% of the entire fossil fueled energy generation inventoried was the responsibility of only five companies: Petrobras (28.7%), Eneva (14.7%), Engie Brasil Energia (10.5%), Électricité de France – EDF (9.4%) and Eletronorte (9.0%).
- Three companies accounted for 59.1% of emissions: Petrobras (24.9%), Engie Brasil Energia (19.0%) and Eneva (15.2%). Eletronorte (6.7%), Électricité de France – EDF (6.1%), Eletrosul (5.0%), EDP (4.6%), Neoenergia (2.9%), Rio Doce Energia (2.5%) and J&F Investimentos (1.8%) appear next. These ten generating companies account for 88.8% of 2020 emissions, which is equivalent to more than 29 million tons of greenhouse gasses.
Emissions rate per energy company (tCO2e/GWh)
- Regarding the rate of CO2eemissions, the company that emitted the most greenhouse gasses per electricity generated was Eletrosul with 1,327 tCO2e/GWh – more than double the average observed in SIN (608 tCO2e/GWh). The company owns 100% of Candiota III shareholder control, a coal-fired power plant with the highest emission rate among the plants that supplied power to SIN in 2020.
- Despite being the largest emitter in absolute terms, Petrobras presented an emission rate (483 tCO2e/GWh) much lower than the average of fossil fueled thermoelectric power plants in the SIN. This is because most of the plants controlled by the company use technologies that achieve greater energy efficiencies.
Distribution of greenhouse gas emissions in the territory
- The Southeast/Midwest subsystem, the largest emitter, accounted for 32% of the total greenhouse gas emissions, mainly due to the state of Rio de Janeiro. Followed by the South subsystem, which emitted 26% GHG despite producing only 16% of the inventoried electricity. In this subsystem are located five of the eight Brazilian coal-fired power plants.
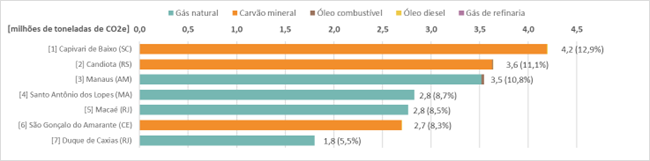
- Seven cities account for 66% of the emissions of thermoelectric generation (figure below). The cities of Capivari de Baixo, in Santa Catarina, and Candiota, in Rio Grande do Sul, where there are, in total, five coal-fired power plants, are the two largest emitters in the country, being responsible for almost a quarter of the total inventoried.
NITROGEN OXIDE EMISSIONS (NOX)
- Emissions of air pollutants (NOX) of only 41 of the 72 fossil fueled thermoelectric power plants were listed. For the other plants, the information was not present in IBAMA’s open data platform or it was inconsistent.
- Coal-fired power plants are the main emitters of NOX. The three plants installed in the city of Santa Catarina Capivari de Baixo (with 25,000 inhabitants), also near to urbanized areas of Tubarão (107,000 people), produce annually the equivalent of five times what São Paulo’s bus fleet, one of the largest public transportation systems in the world, with about 14,000 buses.
- The ten thermoelectric power plants with the highest NOx emissions are located, respectively, in the following cities: Capivari de Baixo (SC), Candiota (RS), Duque de Caxias (RJ), Linhares (ES), São Gonçalo do Amarante (CE), João Pessoa (PB) and Macaé (RJ).
- Judging by the thermoelectric projects registered in recent electricity auctions, the densification of power plants in the same territory seems to be a trend for the near future, which can cause even more relevant impacts on the air quality of these locations. This situation has occurred in the vicinity of industrial and port complexes integrated with liquefied natural gas (LNG) terminals.
ACCESS TO QUALITY INFORMATION
- An important challenge for the preparation of this inventory was obtaining good quality and publicly accessible information, especially regarding environmental indicators of thermoelectric power plants and their controllers. It was evident that there is a long distance to go in Brazil, both for an effective public management of the environment and for the transparent and consistent implementation of recent manifest practices of Environmental, Social and Corporate Governance (ESG) by companies in the electricity sector.
Translation: Edoardo Lobl